Testing & Debugging
Learning Outcomes
After reading this section, you will be able to:
- Trace the execution of a complete program to validate its correctness
Introduction
Testing and debugging skills are integral skills that a software developer refines throughout their career. Testing ensures that a program executes successfully for a well-defined range of values. Such a program might still crash for values outside this range. Each program needs to be thoroughly tested before release to a user community and with each patch to that release. Compilers identify syntactic errors with respect to the rules of the programming language, but cannot readily identify semantic errors; that is, errors in the meaning or intent of the code. Walkthroughs and code analysis help identify these errors.
Much of the time and effort involved in ensuring that a program executes correctly for all practical cases is spent on testing and debugging. Testing ensures that all of the paths through the program envisaged by the designer produce correct results. Debugging locates those 'bugs' that produce incorrect results. Over the years, computer scientists have developed sophisticated tools for testing and debugging. These tools are available in various development environments. The traditional walkthrough technique simulates instruction-by-instruction stepping of the CPU and its updating of program data in primary memory.
This chapter describes the kinds of errors that are common in source code, introduces testing and debugging techniques, and shows how to layout program variables in tabular form to facilitate comprehensive walks through the source code.
Errors
Programming errors are classified into either of two kinds:
- syntactic errors
- semantic errors
Syntactic Errors
Syntactic errors are errors that break the rules of the programming language. The most common syntactic errors in the C language are:
- missing semi-colon
- unnecessary semi-colon terminator in a #define directive
- undeclared variable name
- mismatched parentheses
- left-side of an assignment expression is not a defined memory location
- return statement is missing
Techniques for identifying syntactic errors include:
- reading code statements (walkthroughs)
- compiler error messages (compiler output)
- comparing error messages from different compilers - some are more cryptic than others
Semantic Errors
Semantic errors are errors that fail to implement the intent and meaning of the program designer. The more common semantic errors are:
=instead of==- iteration without a body (for/while followed by a semi-colon)
- uninitialized variable
- infinite iteration
- incorrect operator order in a compound expression
- dangling else
- off-by-one iteration
- integer division and truncation
- mismatched data types
&instead of&&
Techniques for identifying semantic errors include:
- vocalization - use your sense of hearing to identify the error (compound conditions)
- intermediate output -
printf()statements at critical stages - walkthrough table
- interactive debugging using
- Visual Studio IDE - integrated debugger for Windows OSs
- Eclipse IDE - integrated debugger for Linux OSs
- gdb - GNU debugger for gcc
Testing Techniques
The two categories of software testing techniques are:
- black box
- white box
Black Box Tests
The simplest type of test is a black box test. Black box tests are data-driven. We run the executable and treat it as a black box where all internal logic has been hidden from view. External factors alone determine the success or failure of our tests. We test against the specifications. Our tests are input-output driven.
Equivalence Classes
The number of possibilities to be tested in a comprehensive black box test regime is typically too large. To reduce this number to a manageable set, we introduce equivalence classes.
We create equivalence classes using boundary values. An equivalence class is a set where testwise any member is as good as any other (for example, i <1, =1...25, >25).
Experts suggest that semantic errors frequently exist at and on boundaries. We test either side of the boundaries of the equivalence class as well as the boundary itself (for example, i = 0, 1, 2, 17, 24, 25, 26).
We use equivalence classes for both input and output.
White Box Testing
The complementary test to black box tests is a white box test. White box testing is logic-driven. We treat the program as a glass box with all internal logic visible. Each white box test is path-oriented.
In white box testing, we execute each possible path through the code at least once. The number of paths may be too large to test. To reduce this number and still cover all paths through the code at least once, we prepare flow graphs.
Flow Graphs
A flow graph models the sequences, selections and iterations in the source code. A flow graph consists of nodes and edges. Each node represents one or more sequence statements. Each edge represents the flow of control between two nodes.
Consider the following code:
// Testing - Flow Graph
// flowGraph.c

#include<stdio.h>

int main(void)
{
  int total, value, count;

  // Start Node 1 ---
  total = 0;
  count = 0;
  // End   Node 1 ---

  do {
      // Start Node 2 ---
      scanf("%d", &value);
      // End   Node 2 ---

      if (value < 0)
      {
          // Start Node 3 ---
          total -= value;
          count++;
          // End   Node 3 ---
      }
      else if (value > 0)
      {
          // Start Node 4 ---
          total += value;
          count++;
          // End   Node 4 ---
      }

  // Start Node 5 ---
  } while (value != 0);
  // End   Node 5 ---

  if (count > 0)
  {
      // Start Node 6 ---
      printf("The average value is %.2lf\n",
             (double)total/count);
      // End   Node 6 ---
  }

  // Start Node 7 ---
  return 0;
}
The flow graph illustrating the above code would look like:

Test Criteria
To complete a white box test, we apply the following criteria:
- statement coverage - every elementary statement is executed at least once
- edge coverage - every edge is traversed at least once
- condition coverage - all possible values of the constituents of each compound condition are exercised at least once
- path coverage - all paths from the initial node to the final node are traversed at least once.
- iteration coverage
- skip the iteration entirely
- pass through the iteration once
- pass through the iteration less than the specified number of times
- pass through the iteration the specified number of times
- pass through the iteration once more than the specified number of times
- compound condition coverage
- break each compound condition into simple conditions
Debugging Techniques
The tools available for debugging in this course include:
- an integrated development environment (IDE)
- a command-line debugger
Use the source code listed below in the following examples:
// Debugging Example
// debug.c

#define _CRT_SECURE_NO_WARNINGS
#include<stdio.h>

int main(void)
{
  int total, value, count;

  total = 0;
  count = 0;
  do {
      printf("Enter a value (0 to stop) ");
      scanf("%d", &value);

      if (value < 0)
      {
          total -= value;
          count++;
      }
      else if (value > 0)
      {
          total += value;
          count++;
      }
  } while (value != 0);

  if (count > 0)
  {
      printf("The average value is %.2lf\n",
             (double)total/count);
  }
  return 0;
}
IDE Debugging
Integrated Development Environments (IDEs) are elaborate programs that support text editing, coding, compiling, testing and debugging in a unified application. The IDE used in this course is Microsoft's Visual Studio.
Build and Execute
To build and execute a C program in Visual Studio 2013 (or newer) we:
- Start Visual Studio
- Select New Project
- Select Visual C++ -> Win32 -> Console Application
- Enter Debugging Example as the Project Name | Select OK
- Press Next
- Check Empty Project | Press Finish
- Select Project -> Add New Item
- Select C++ File | Enter debug.c as File Name | Press Add
- Paste in a copy of debug.c (see above)
- Select Build | Build Solution
- Select Debug | Start without Debugging
- Enter 3 at the input prompt
- Enter 2 at the input prompt
- Enter 0 at the input prompt
The input prompts and results of execution appear in a Visual Studio command prompt window.
Tracing
To trace through execution of our program using the built-in debugger we:
- Move the cursor to the left-most column of the total = 0; statement and left-click | This places a red dot in that column, which identifies a breakpoint
- Move the cursor to the left-most column of the closing brace for the do while iteration and left-click | This places a red dot in the column, which identifies another breakpoint
- Move the cursor to the left-most column of the return statement and left-click | This places a red dot in the column, which identifies another breakpoint
- Select Debug -> Start Debugging | Execution should pause at the first breakpoint
- Observe the values under the Locals tab in the Window below the source code
- Press F10 until the input prompt appears and answer the prompt by entering 3
- Observe the values under the Locals tab in the window below the source code
- Press F5, note the position of the arrow identifying the next statement to be executed, and observe the value of total
- Press F5 and answer the prompt by entering a value of 2
- Press F5, note the position of the arrow identifying the next statement to be executed, and observe the value of total
- Press F5 and answer the prompt by entering a value of 0
- Press F5, note the position of the arrow identifying the next statement to be executed, and observe the value of total
- Press F5 and
- Select the command prompt window and observe the program output
- Select the source code window
- Press F5 again to exit
The keystrokes for the various debugging options available in this IDE are listed next to the sub-menu items under the Debug menu.
- F5 continue executing until the next breakpoint
- F10 execute the next statement
Command-Line Debugging
The GNU debugger is a command-line debugging tool called gdb that ships with the gcc compiler for Linux platforms.
Compile and Run
To be able to use gdb, we compile our source code with the -g option:
gcc -g myProgram.c
To debug the executable (a.out), we enter:
gdb a.out
The gdb prompt will appear:
(gdb)
When we start gdb, our program pauses. This is our first opportunity to set breakpoints. We enter the run command only once you are ready to execute.
Debugging Commands
The gdb commands that we may enter at the prompt include:
list- lists the 10 lines of source code in the vicinity of where execution has stopped. Each call advances the current line by 10list m, n- where m and n are line numbers - lists lines m through n inclusive of the source code. This call advances the current line to n+1break n- where n is a line number - sets a breakpoint at line number nclear n- where n is a line number - clears any breakpoint or trace at line number ndelete- clears all breakpointsrun- starts the execution of your program from line 1print varname- where varname is a variable name - displays the value of varnamecont- continues execution until either your program ends or encounters a breakpointstep- executes one line of your programhelp- displays the full set of commands availablequit- quits
gdb is case-sensitive.
Crashes
If our program crashes and produces a core dump, gdb can help locate the crash point. We enter:
gdb a.out core
and use the following commands:
- where - displays the procedure and line number at the time of the crash
- up - moves up one procedure in the stack (towards
main()) - down - moves down one procedure in the stack (away from
main())
Help
For online help with a particular command while debugging, we enter:
help commmand
where command is the command in question.
For online help with the gdb command while not debugging, we enter:
man gdb
Walkthrough Table
Walkthroughs are an important technique for understanding the control flow and the memory changes of a source code snippet. A walkthrough emulates the CPU stepping through the code. A walkthrough solution consists of two parts:
- a record of every change in the value of every program variable
- a listing of the output, if any, produced by the program
The record of changes lists all changes that have occurred in RAM during the execution of the program.
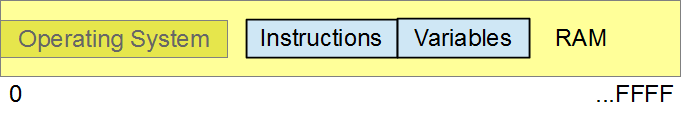
When the operating system loads a program into RAM, the program instructions occupy one part of memory while the program variables occupy another part. The operating system transfers control to the program's first instruction. The program executes one instruction at a time until it returns control to the operating system. Some instructions accept input from the user, some change the values stored in the program variables, and others send output to the user.
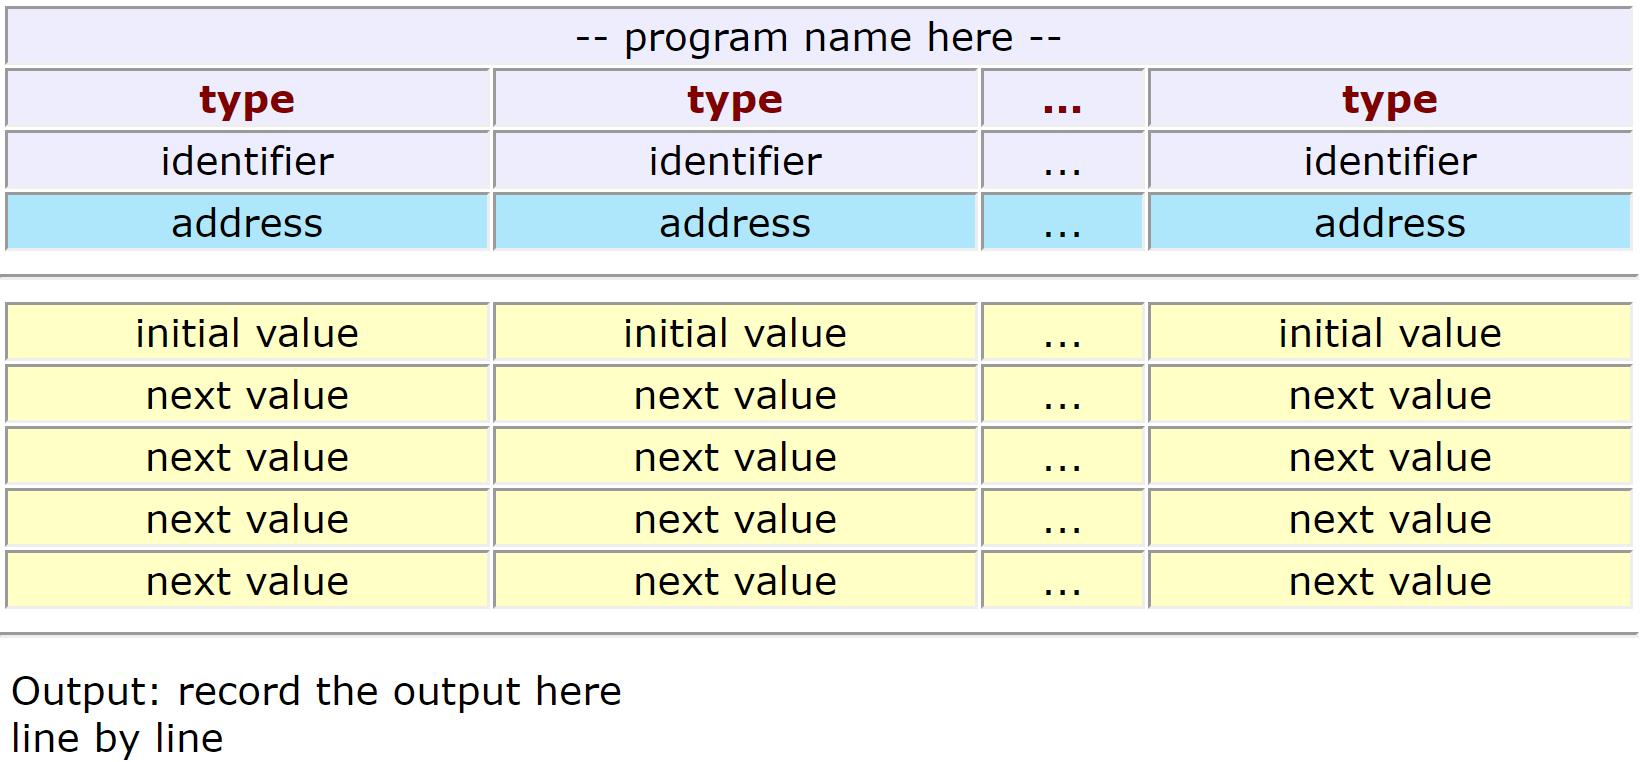
To track each change in RAM, we construct a table of the program variables. We list their identifiers and their types across its top line and enter their values in the rows below. We insert mock addresses below the identifiers, picking convenient address values; the actual addresses do not matter here. In other words, our walkthrough table is a simplified representation of RAM throughout the program's lifetime.
Consider the program below:
// Walkthrough
// walkthrough.c

#include <stdio.h>
#define ADULT_FARE 3.25

int main(void)
{
  int riders;
  double total;

  printf("Number of riders : ");
  scanf("%d", &riders);

  total = riders * ADULT_FARE;
  printf("Total fare is %.2lf\n\n", total);

  printf("riders' address %x\n", &riders);
  printf("total's address %x\n", &total);

  return 0;
}
The output of the program above displays the following:
Number of riders : 3
Total fare is 9.75

riders' address 0xbf9cf5bc
total's address 0xbf9cf5b0
The instructions part of the table is optional and may be replaced by the line numbers corresponding to these instructions. The walkthrough table is shown below:
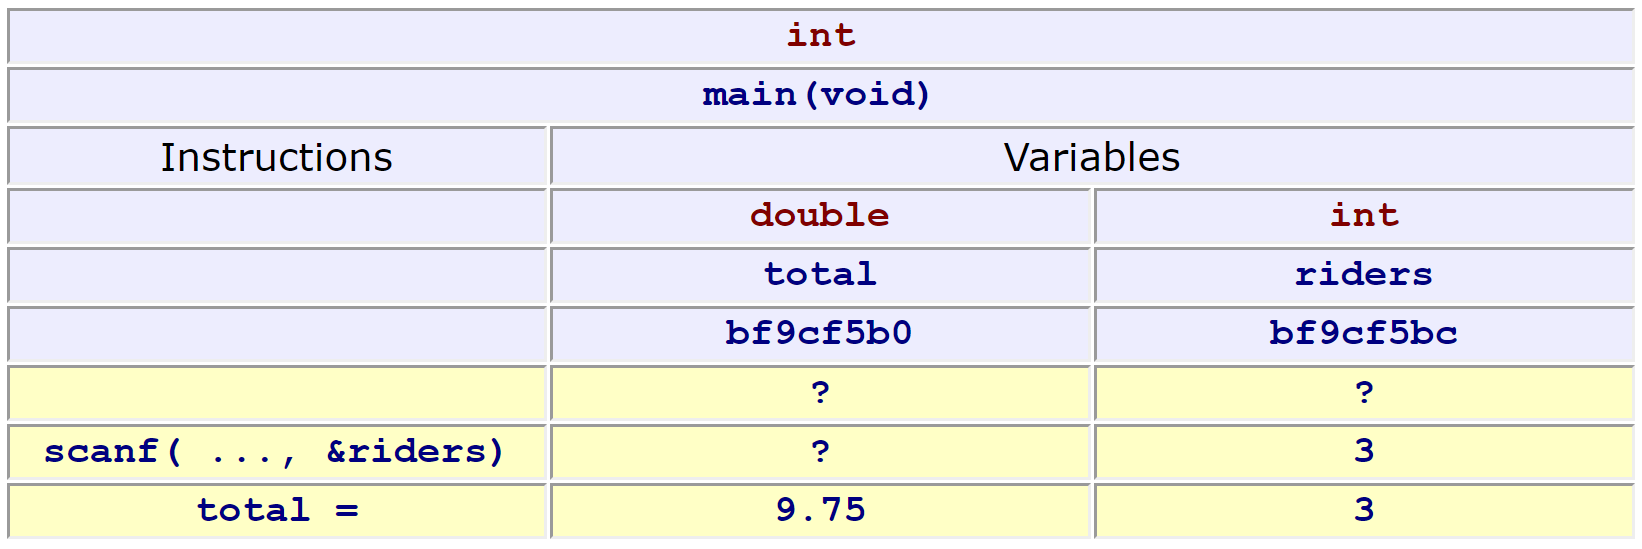
A style that is sufficient for programs discussed in this set of notes is shown below. Note that the table header includes the type and the address of each variable.
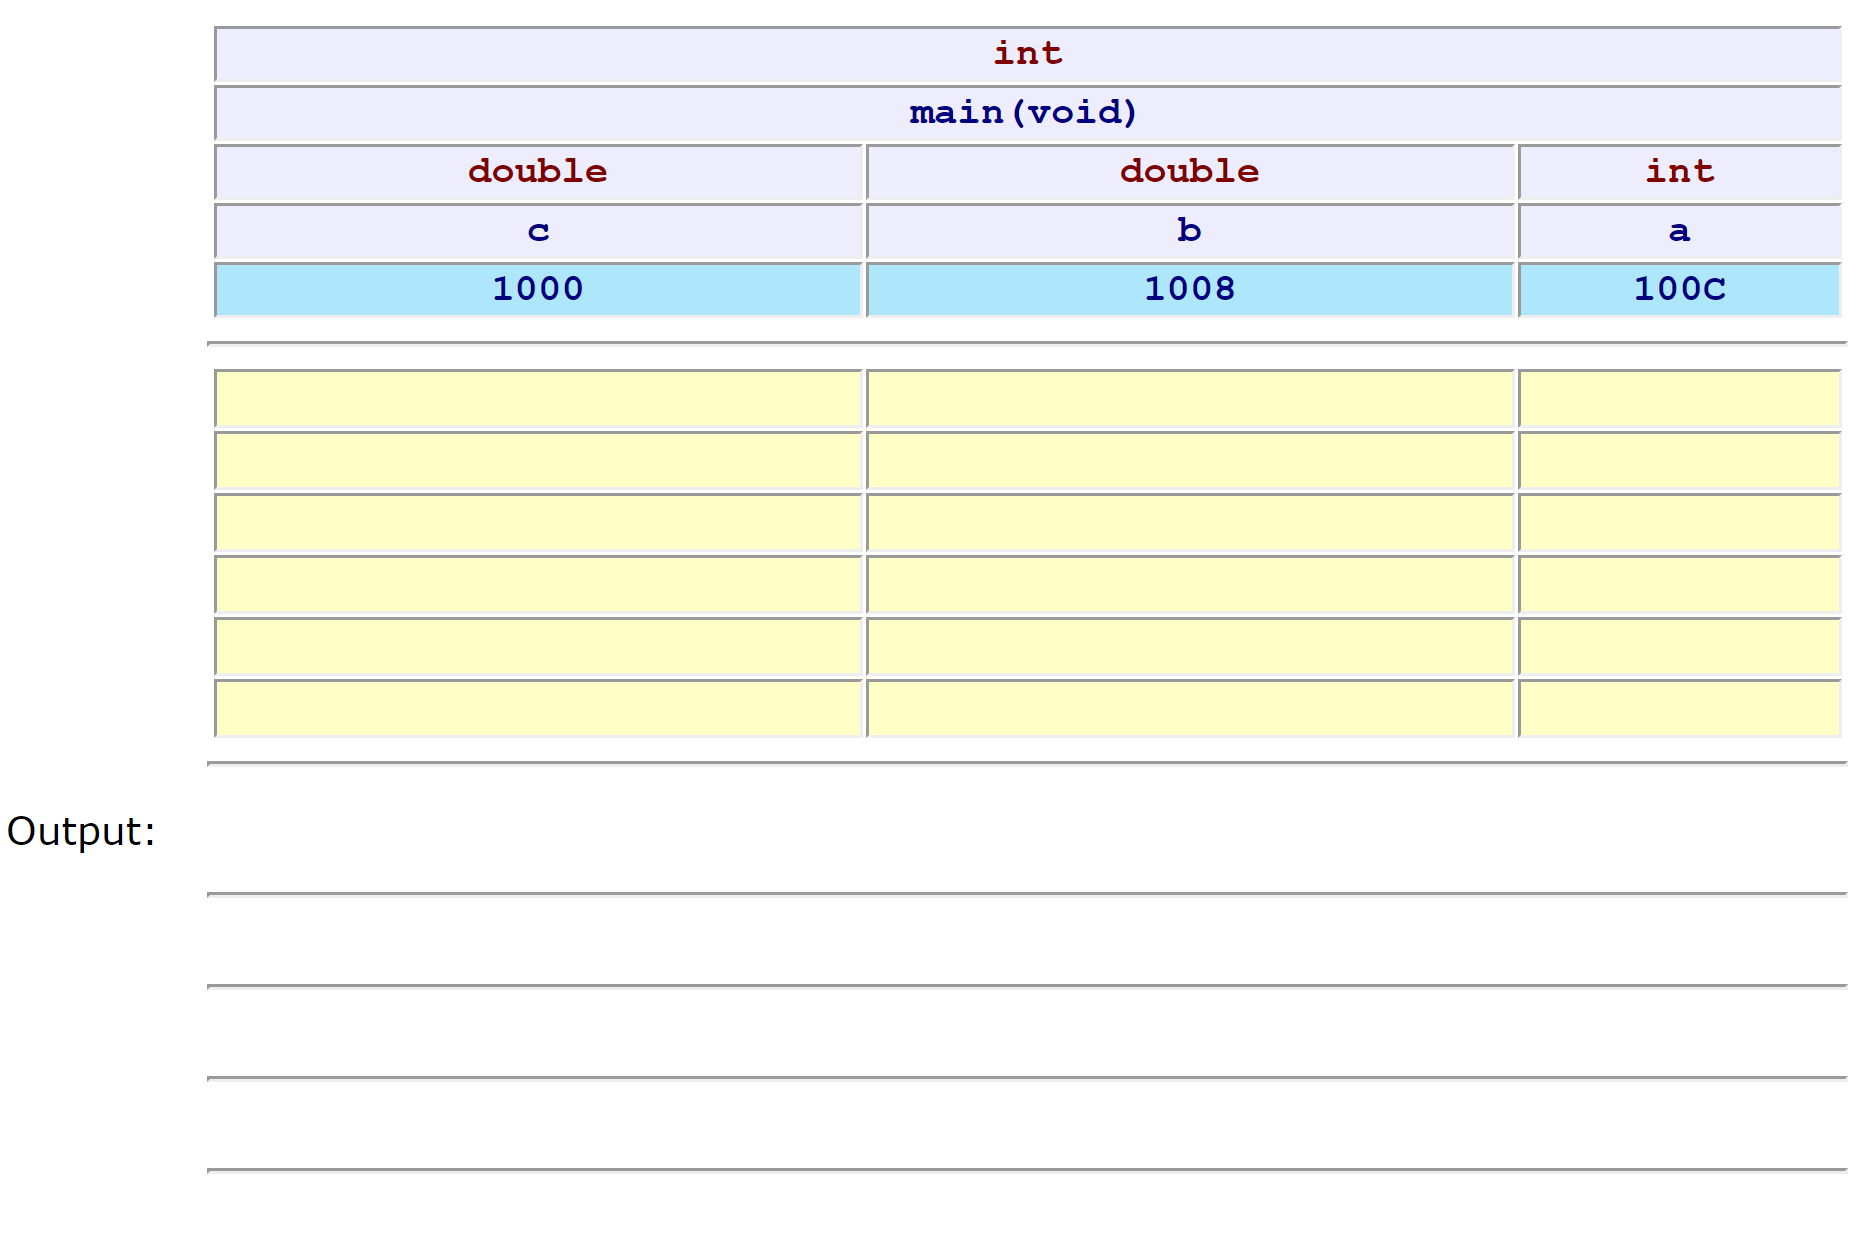
Example
Consider the following code:
// by Evan Weaver

int main(void)
{
    int a;
    double b, c;

    a = 6;
    b = 0.7;

    while (a < 10 && b < 3.0
    {
        if (a < 8)
        {
            a = a + 1;
            b = b * 2;
            c = a - b; // careful: mixed types
        }
        else
        {
            a = a - 2;
            b = b + 0.8;
        }

        c = a - b;
        printf("%.2lf-%d-%.2lf\n", c, a, b);
    }
}
We prepare the walkthrough table by:
- inserting the name of the program (done)
- showing the type of each variable (done)
- showing each variable's identifier (done)
- showing a unique address for each variable (done)
Complete the rest of this table as an exercise!